Key features
❗ Important: The documentation in this topic refers to a feature or product that is currently in Early Availability status. Features in Early Availability status are only available in production to a limited number of customers based on fit with specific use cases. For more information about Early Availability status, see Product lifecycle phases. If you would like to use the product capabilities described here during the Early Availability phase, contact your AppDirect technical representative.
After you have successfully connected your data sources and organized your dashboards, another question emerges: how will you structure interaction with your AppInsights dashboards?
AppInsights can be used to passively monitor KPIs to ensure that anomalies are immediately recognized—a devops team might fit this use case, for example. It can be used to automate the reporting of key metrics to a variety of stakeholders with unique areas of focus—perhaps to update management on team success. It can also be used more actively with strong processes and team activities structured around dashboard activity and alerts.
Ideally, you will find a healthy medium between these three approaches that works for your entire team. In the next four sections, we will outline what tools you will have at your disposal, regardless of the processes you design around your use of the AppInsights app.
Actionable KPIs
It’s not uncommon for our dashboards to be displayed on large screens in conference rooms, call centers, or sales floors—they motivate teams and make it easy for key stakeholders to keep an eye on progress. Here are some additional pieces of AppInsights functionality that will enhance your experience with your dashboards and ensure that no metric activity goes unnoticed.
Alerts
Setting up alerts for your widgets ensures that you are immediately notified when a goal is reached, or a KPI falls below an acceptable threshold. To begin setting up widget alerts, start by navigating to the primary AppInsights settings icon and selecting the “Alerts” menu. Using the data stream identifier for your widget(s), you can set unique alert(s) based on a goal or threshold for your KPI. There is no limit to the number of alerts you can set or the number of recipients for the notification. Full instructions can be found in our Alerts tutorial. Please note that it is not possible to set alerts for widgets that are populated with custom data using our CSV upload or Push and Fetch data tools.
Goals
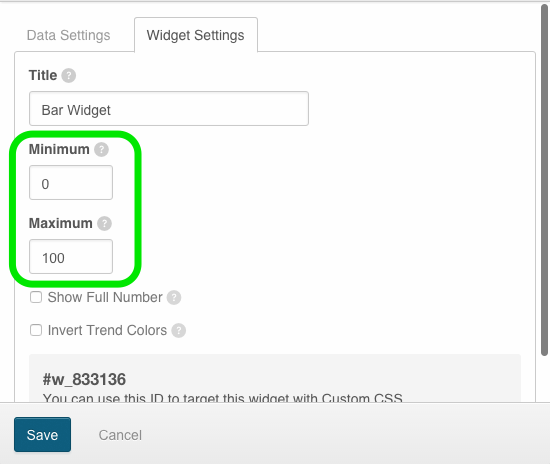
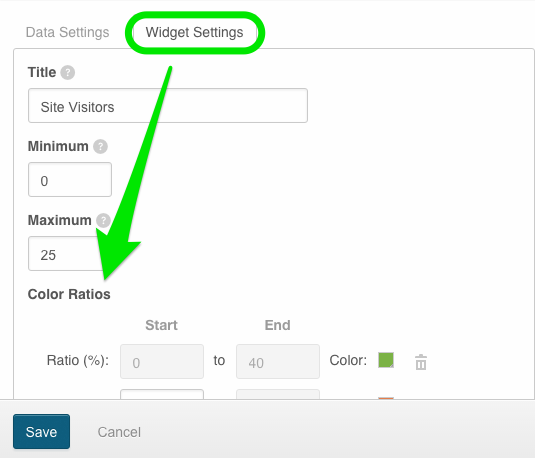
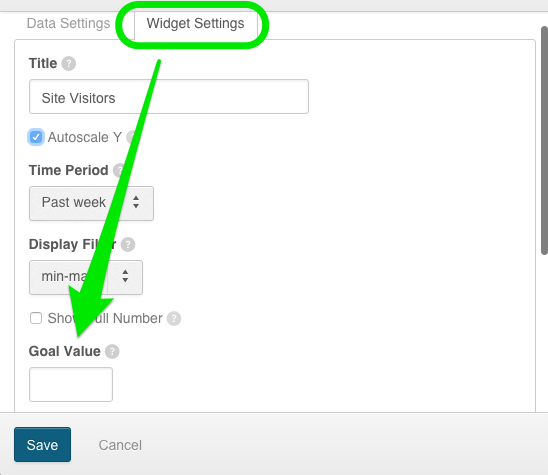
A number of our visualizations allow you to add visual goal lines or target areas that will immediately notify users when an important threshold has been reached. To set your goals for the visualizations listed below, start by entering the “Edit Widget Settings” menu and navigating to the Widget Settings tab.
Horizontal / Vertical Bar
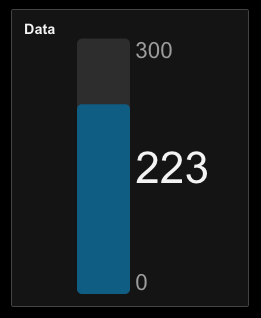
Specify the minimum and maximum values of your bar so you have real-time information on progress towards goal. You can also use these values to ensure that a data point stays within certain bounds.

Dial
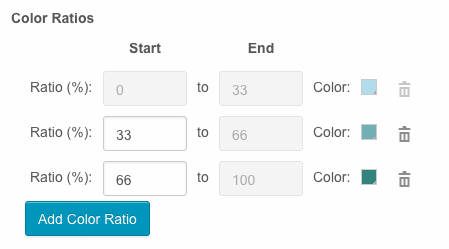
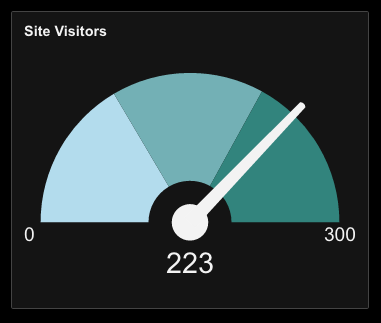
In addition to using the Widget Settings menu to specify a minimum and a maximum value, the dial widget allows you to segment your visualization with multiple colors so you understand how your KPI is performing against multiple areas of interest.
Stoplight
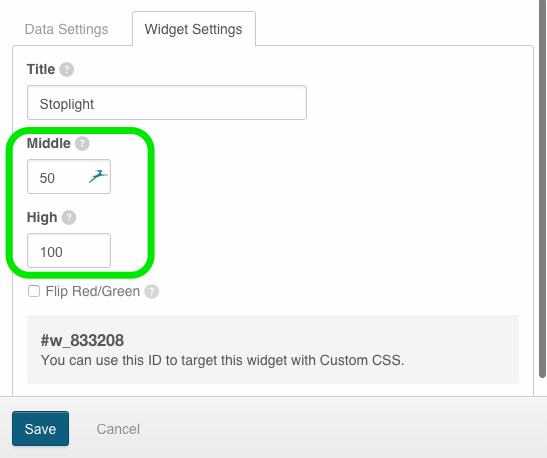
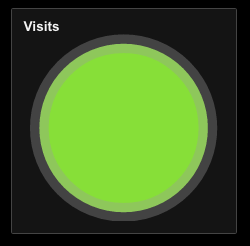
You can use our stoplight widget in a similar fashion to the dial widget. By specifying a middle and high value, you can track how well (or how poorly) a data point is tracking towards goal using a red / orange / green light system.
Please note that stoplight widgets do not actually present your data in numerical format. It will only be represented visually in relationship to the “Middle” and “High” values you specify.
Sparklines and line graphs
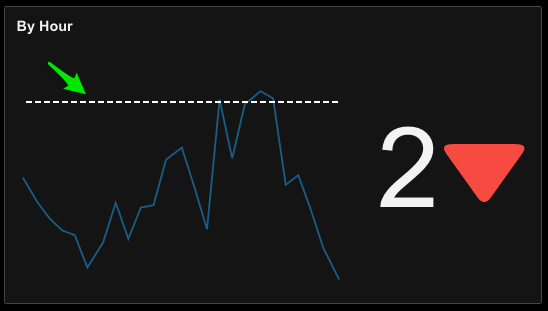
Both of these visualization types allow you to specify a goal value that is represented by a solid horizontal line across your graph. From the widget settings tab, simply specify your goal value and click save to capture it on your visualization.
Please note that your goal line will not appear if you have manually set the bounds of your y-axis above or below the value of the goal line.
Was this page helpful?
Tell us more…
Help us improve our content. Responses are anonymous.
Thanks
We appreciate your feedback!